The Nigerian Bureau of Statistics recently released a comprehensive list of JAMB applications by Geopolitical regions / States of origin, covering a period of 7 years from (2010-2016).
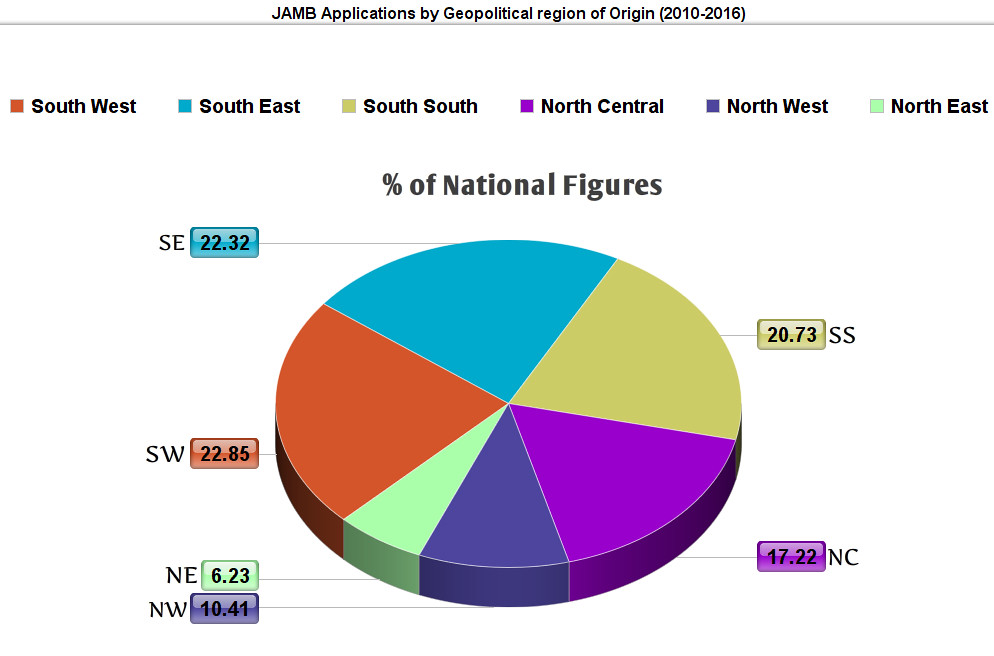
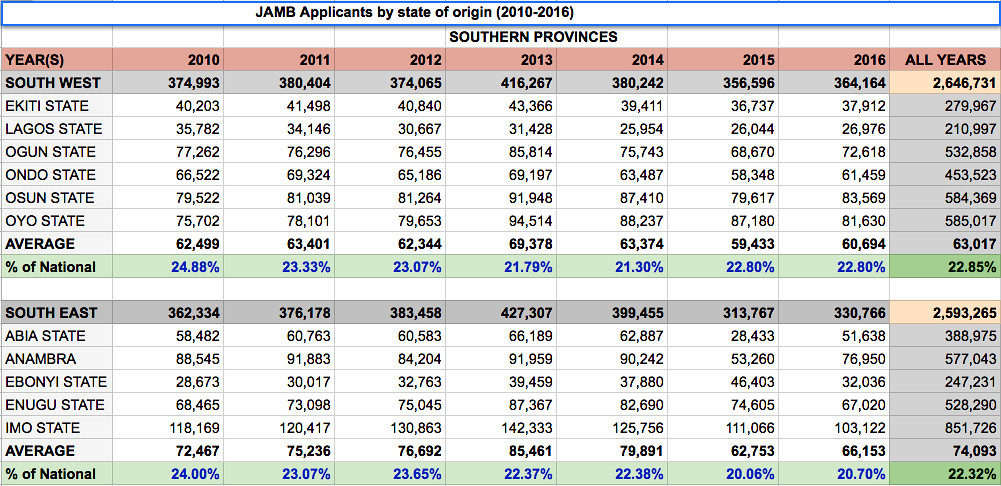
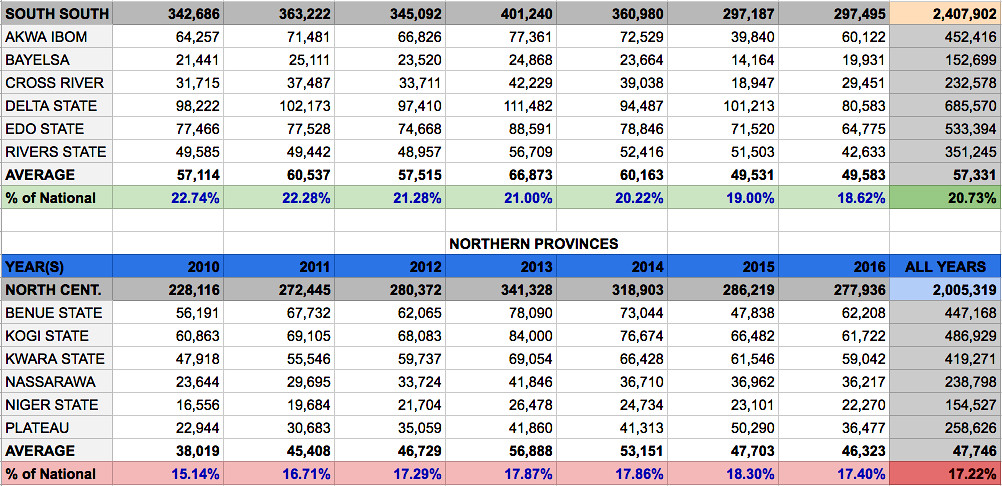
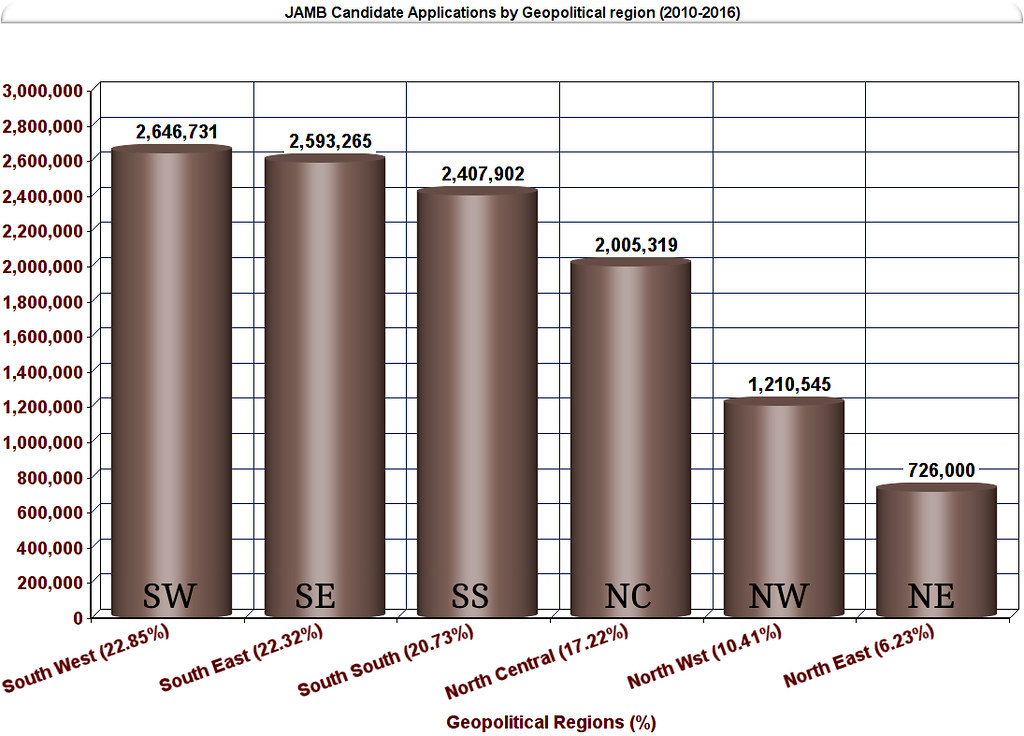
What the statistics showed has been quite revealing. Figures compiled from the NBS Showed that the South West region led in the total number of Applications with 2,646,731 representing some 22.85% of all applications from the country. The South East region followed with 2,593,265 applications or 22.32% followed in turn by the South South Zone with 2,407,902 applications or 20.73%.
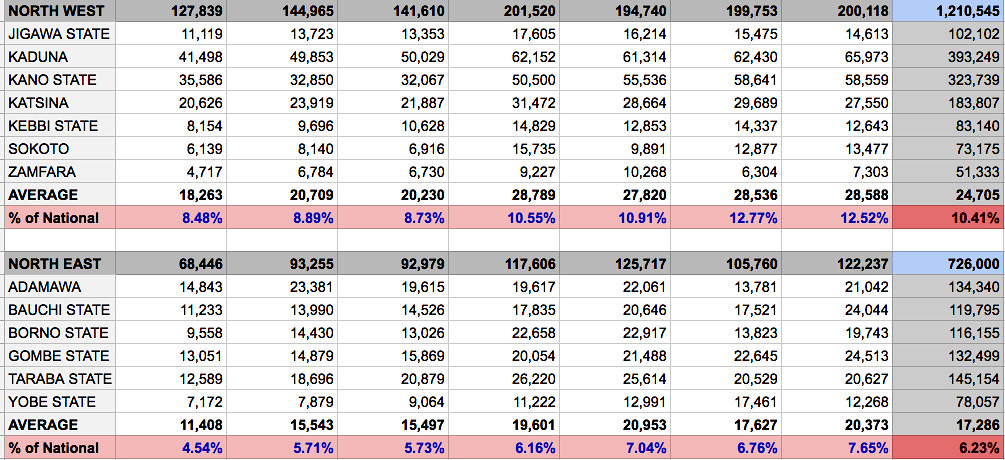
In the Northern region of the country, the North Central region led and was more similar to the south than to the North in terms of figures, with 2,005,319 Applications or 17.22%. The North West managed 1,210,545 or 10.41% over the six year period under review, while the North East region had the least applications with 726,000 representing some 6.23% of applications in the country.
Further analysis revealed that the South-West region led in Four of the Seven years: 2010 (24.88%), 2011 (23.33%), 2015 (22.80%), and 2016 (22.80%) – While the South East led in Three: 2012 (23.07%), 2013 (22.37%) and 2014 (22.38%).
Figures also show that the North-West and North-East have been steadily improving on their total number of candidate applications and percentage share of total national figures from 2010 where they accounted for 8.48% and 4.54% respectively to 2016 where they accounted for 12.52% and 7.65%.
Visualizations of the statistics are presented below:-
Ranking of Geopolitical regions by Applications numbers | % of National Figures
1 – South West – 2,646,731 | 22.85%
2 – South East – 2,593,265 | 22.32%
3 – South South – 2,407,902 | 20.73%
4 – North Central – 2,005,319 | 17.22%
5 – North West – 1,210,545 | 10.41%
6 – North East – 726,000 | 6.23%
Regional scrutinization of the figures shows that Oyo state led the pack in the South-West, closely followed by Osun and Ogun. Imo state led in the Southeast by a large margin, followed by Anambra and Enugu.
In the North-central, Kogi state led followed closely by Benue and Kwara. In the North-West, Kaduna led, followed by Kano and Katsina trailing in a distant third position, while in the Northeast, Taraba state led, followed by Adamawa and then Gombe.
Nationally, the top 15 states were: Imo, Delta, Oyo, Osun, Anambra, Edo, Ogun, Enugu, Kogi, Ondo, Akwa Ibom, Benue, Kwara, Kaduna and Abia- in that order.
Surprisingly, very populated states like Rivers, Kano and Lagos did not rank in the top 15, with Kano the most populated state in the country ranking at 17th- only one place above Ekiti the 30th most populated state in the country but which was seated far (12 places) higher than its population position rank would suggest, at 18th position.
Source:- Nigerianstats
Now Playing: Love Bug
Aretti Adi
SPONSORED LINKS
LOAN FOR TRAVEL, VISA, JAPA, PoF UP TO N200M (CLICK HERE)
[CLICK HERE] For Music Artwork, Website Design And SEO Setup
INSTALL 9JAFLAVER MUSIC APP, STREAM, DOWNLOAD, AND PLAY MUSIC OFFLINE
CHECK OUT FUNNY PICTURE AND MEME HERE (CLICK HERE)
Chissom Anthony – Glory To God In The Highest [See Trending Gospel Song]
Copyright © 2014-2026 9jaflaver. All Rights Reserved.
About us | DMCA | Privacy Policy | Contact us
| Advertise| Request For Music | Terms Of Service
9jaflaver is not responsible for the content of external sites.